 Japanese
 English
Risk-Return Performance Chart (Return Distribution), Return Performance and the Currency Exchange Occurrence Ratio
The Risk-Return Performance Chart, Return Performance and the Currency Exchange Occurrence Ratio are based on the past Premium Deposit transactions which matured between November 2015 and March 2025.
-
Returns
The total return for each transaction, based on the deposit currency (the value obtained by dividing total amount of interest and principal profit/loss by the deposited principal), is shown on annualized basis (calculated on 365-day basis).
- *Principal profit/loss: It is calculated only for transactions where currency exchange occurred on the maturity date. The principal profit/loss is determined as the difference between the redeemed principal amount converted to the deposit currency at the published rate on the maturity date and the deposited principal amount.
-
The Risk-Return Performance Chart
The risk is indicated by the variation in the return distribution on the horizontal axis. The 'Number of Transactions' on the vertical axis indicates how many transactions were conducted corresponding to the annualized returns on the horizontal axis. However, since Premium Deposits are products with terms of less than one year, the Number of Transactions is weighted by deposit period.
Calculation Example : In the case where the annualized return for a 7-day Premium Deposit is 5%, it is recorded in the Risk-Return Performance Chart (Return Distribution) as 0.02 transactions in the 5% return category, calculated as 7 days ÷ 365 days ≒ 0.02.
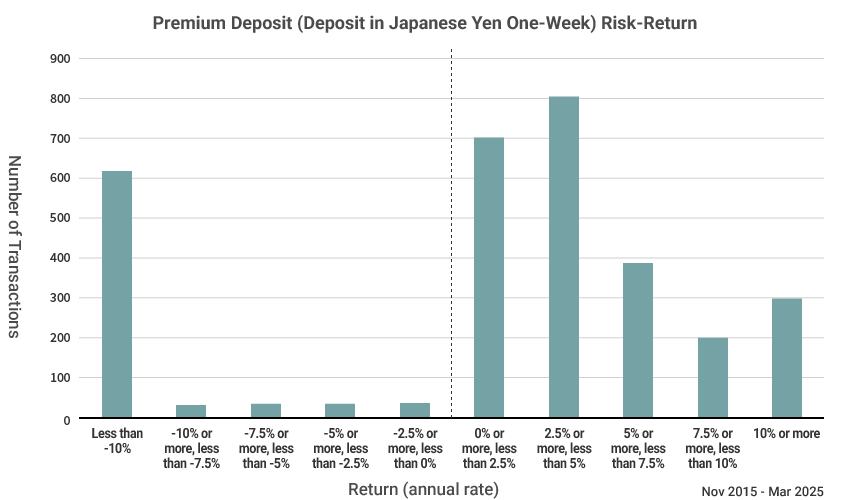
Deposit in Japanese Yen
One-Week
The returns shown below are the notional returns calculated by converting the redeemed principal, which has been exchanged for another currency, back to the deposit currency at the published rate on the maturity date. These are not realized gains or losses (returns).
-
1Risk-Return Chart (Return Distribution)
-
2Return and currency exchange occurrence ratio
- *1The average value is the amount and period weighted average, weighted by the transaction amount and the number of deposit days of the transactions.
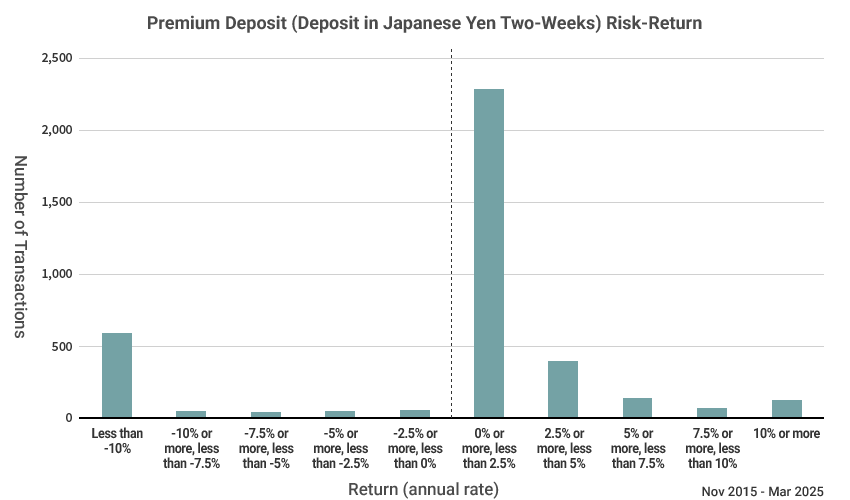
Two-Weeks
The returns shown below are the notional returns calculated by converting the redeemed principal, which has been exchanged for another currency, back to the deposit currency at the published rate on the maturity date. These are not realized gains or losses (returns).
-
1Risk-Return Chart (Return Distribution)
-
2Return and currency exchange occurrence ratio
- *1The average value is the amount and period weighted average, weighted by the transaction amount and the number of deposit days of the transactions.
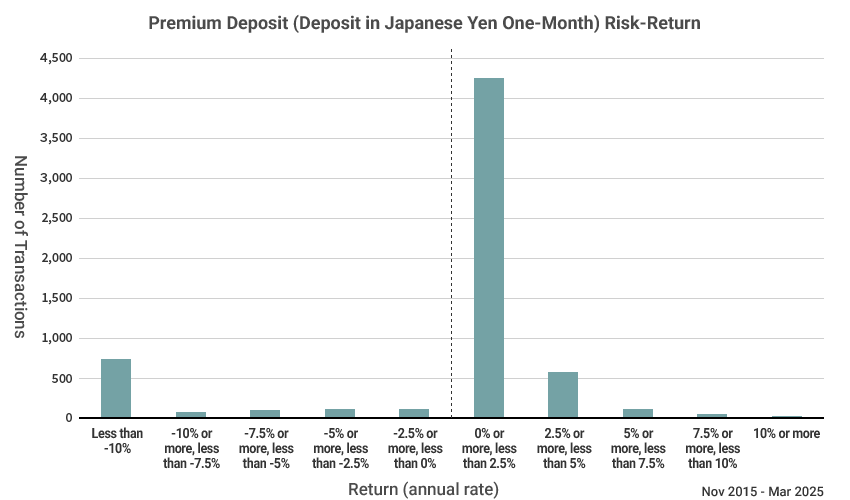
One-Month
The returns shown below are the notional returns calculated by converting the redeemed principal, which has been exchanged for another currency, back to the deposit currency at the published rate on the maturity date. These are not realized gains or losses (returns).
-
1Risk-Return Chart (Return Distribution)
-
2Return and currency exchange occurrence ratio
- *1The average value is the amount and period weighted average, weighted by the transaction amount and the number of deposit days of the transactions.
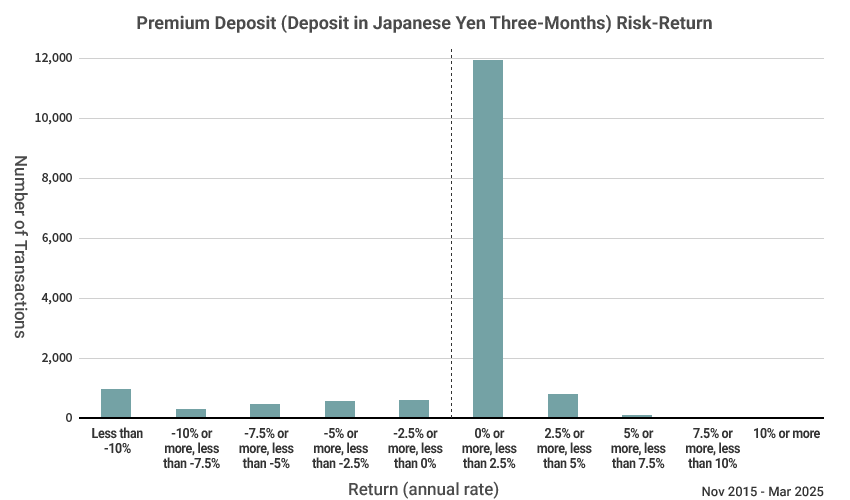
Three-Months
The returns shown below are the notional returns calculated by converting the redeemed principal, which has been exchanged for another currency, back to the deposit currency at the published rate on the maturity date. These are not realized gains or losses (returns).
-
1Risk-Return Chart (Return Distribution)
-
2Return and currency exchange occurrence ratio
- *1The average value is the amount and period weighted average, weighted by the transaction amount and the number of deposit days of the transactions.
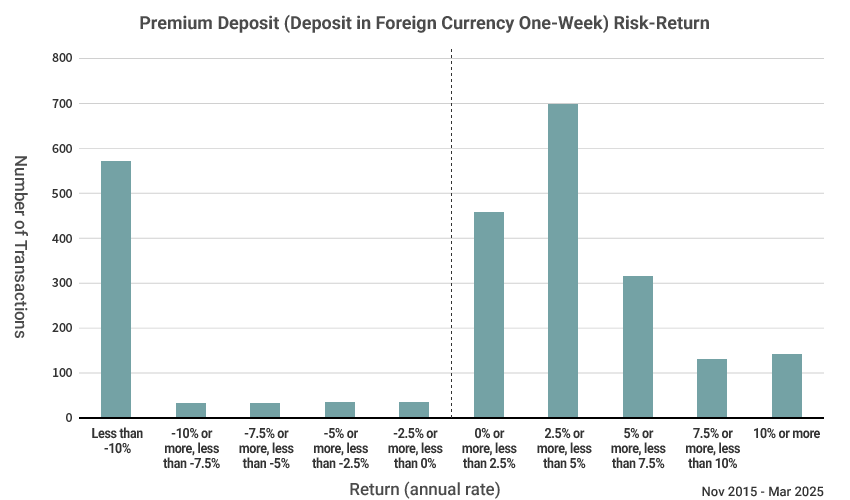
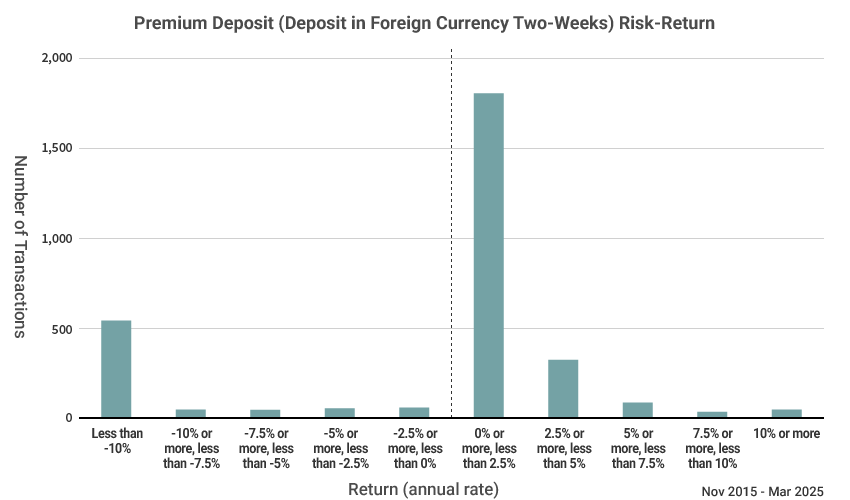
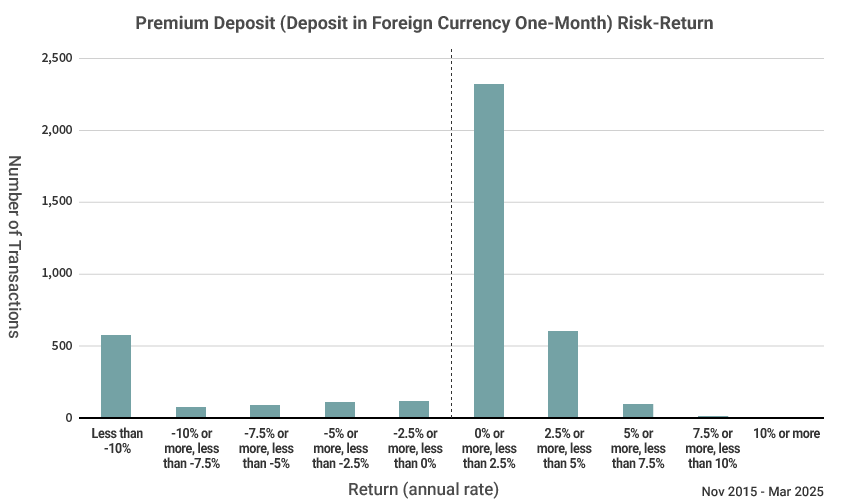
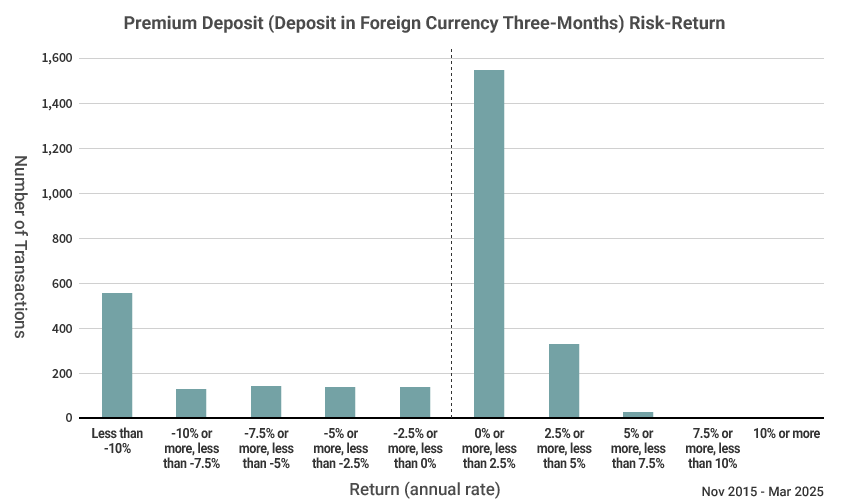
Deposit in Foreign Currency
One-Week
The returns shown below are the notional returns calculated by converting the redeemed principal, which has been exchanged for another currency, back to the deposit currency at the published rate on the maturity date. These are not realized gains or losses (returns).
-
1Risk-Return Chart (Return Distribution)
-
2Return and currency exchange occurrence ratio
- *1The average value is the amount and period weighted average, weighted by the transaction amount and the number of deposit days of the transactions.
Two-Weeks
The returns shown below are the notional returns calculated by converting the redeemed principal, which has been exchanged for another currency, back to the deposit currency at the published rate on the maturity date. These are not realized gains or losses (returns).
-
1Risk-Return Chart (Return Distribution)
-
2Return and currency exchange occurrence ratio
- *1The average value is the amount and period weighted average, weighted by the transaction amount and the number of deposit days of the transactions.
One-Month
The returns shown below are the notional returns calculated by converting the redeemed principal, which has been exchanged for another currency, back to the deposit currency at the published rate on the maturity date. These are not realized gains or losses (returns).
-
1Risk-Return Chart (Return Distribution)
-
2Return and currency exchange occurrence ratio
- *1The average value is the amount and period weighted average, weighted by the transaction amount and the number of deposit days of the transactions.
Three-Months
The returns shown below are the notional returns calculated by converting the redeemed principal, which has been exchanged for another currency, back to the deposit currency at the published rate on the maturity date. These are not realized gains or losses (returns).
-
1Risk-Return Chart (Return Distribution)
-
2Return and currency exchange occurrence ratio
- *1The average value is the amount and period weighted average, weighted by the transaction amount and the number of deposit days of the transactions.
Cross Currency Type
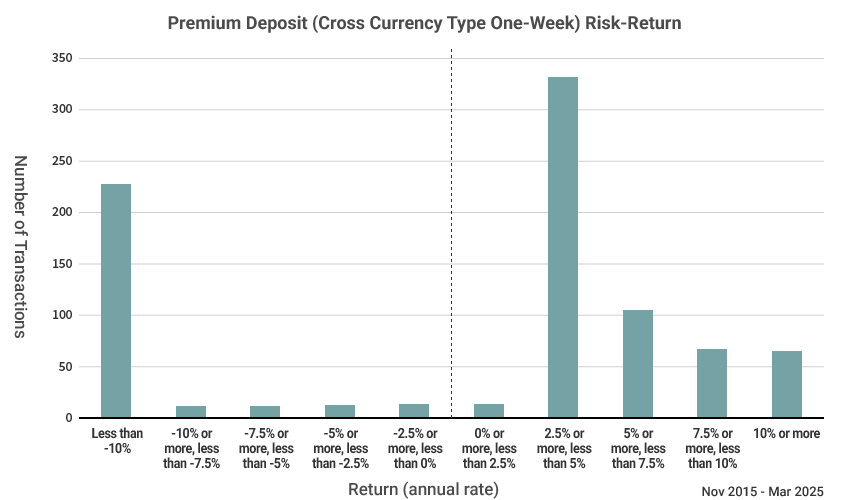
One-Week
The returns shown below are the notional returns calculated by converting the redeemed principal, which has been exchanged for another currency, back to the deposit currency at the published rate on the maturity date. These are not realized gains or losses (returns).
-
1Risk-Return Chart (Return Distribution)
-
2Return and currency exchange occurrence ratio
- *1The average value is the amount and period weighted average, weighted by the transaction amount and the number of deposit days of the transactions.
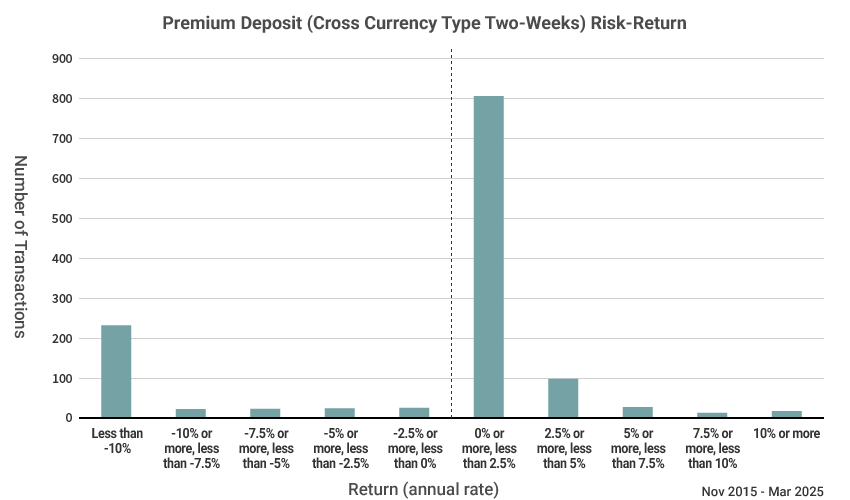
Two-Weeks
The returns shown below are the notional returns calculated by converting the redeemed principal, which has been exchanged for another currency, back to the deposit currency at the published rate on the maturity date. These are not realized gains or losses (returns).
-
1Risk-Return Chart (Return Distribution)
-
2Return and currency exchange occurrence ratio
- *1The average value is the amount and period weighted average, weighted by the transaction amount and the number of deposit days of the transactions.
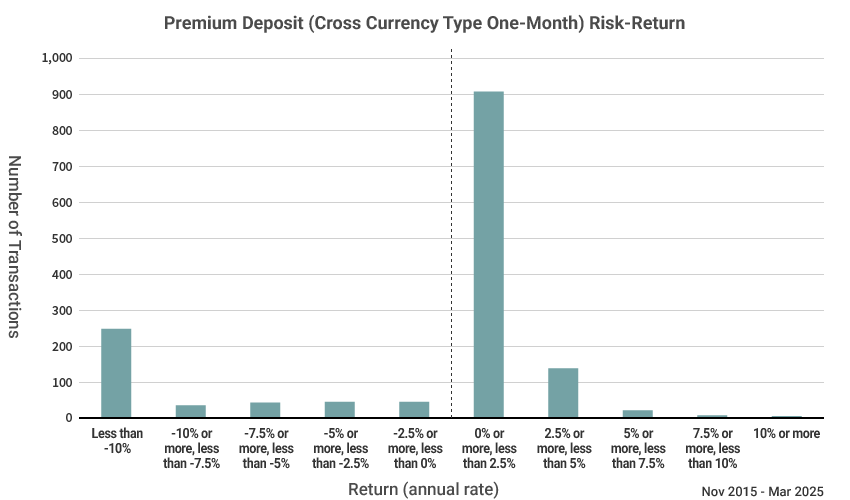
One-Month
The returns shown below are the notional returns calculated by converting the redeemed principal, which has been exchanged for another currency, back to the deposit currency at the published rate on the maturity date. These are not realized gains or losses (returns).
-
1Risk-Return Chart (Return Distribution)
-
2Return and currency exchange occurrence ratio
- *1The average value is the amount and period weighted average, weighted by the transaction amount and the number of deposit days of the transactions.
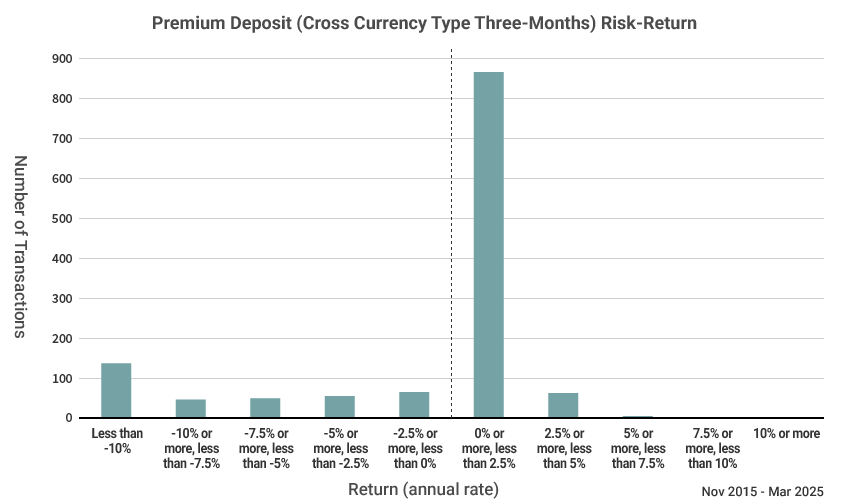
Three-Months
The returns shown below are the notional returns calculated by converting the redeemed principal, which has been exchanged for another currency, back to the deposit currency at the published rate on the maturity date. These are not realized gains or losses (returns).
-
1Risk-Return Chart (Return Distribution)
-
2Return and currency exchange occurrence ratio
- *1The average value is the amount and period weighted average, weighted by the transaction amount and the number of deposit days of the transactions.
- All the data on this page are using past data and do not guarantee future investment performances.
This product entails some risks such as loss of principal. Please see here for the details.